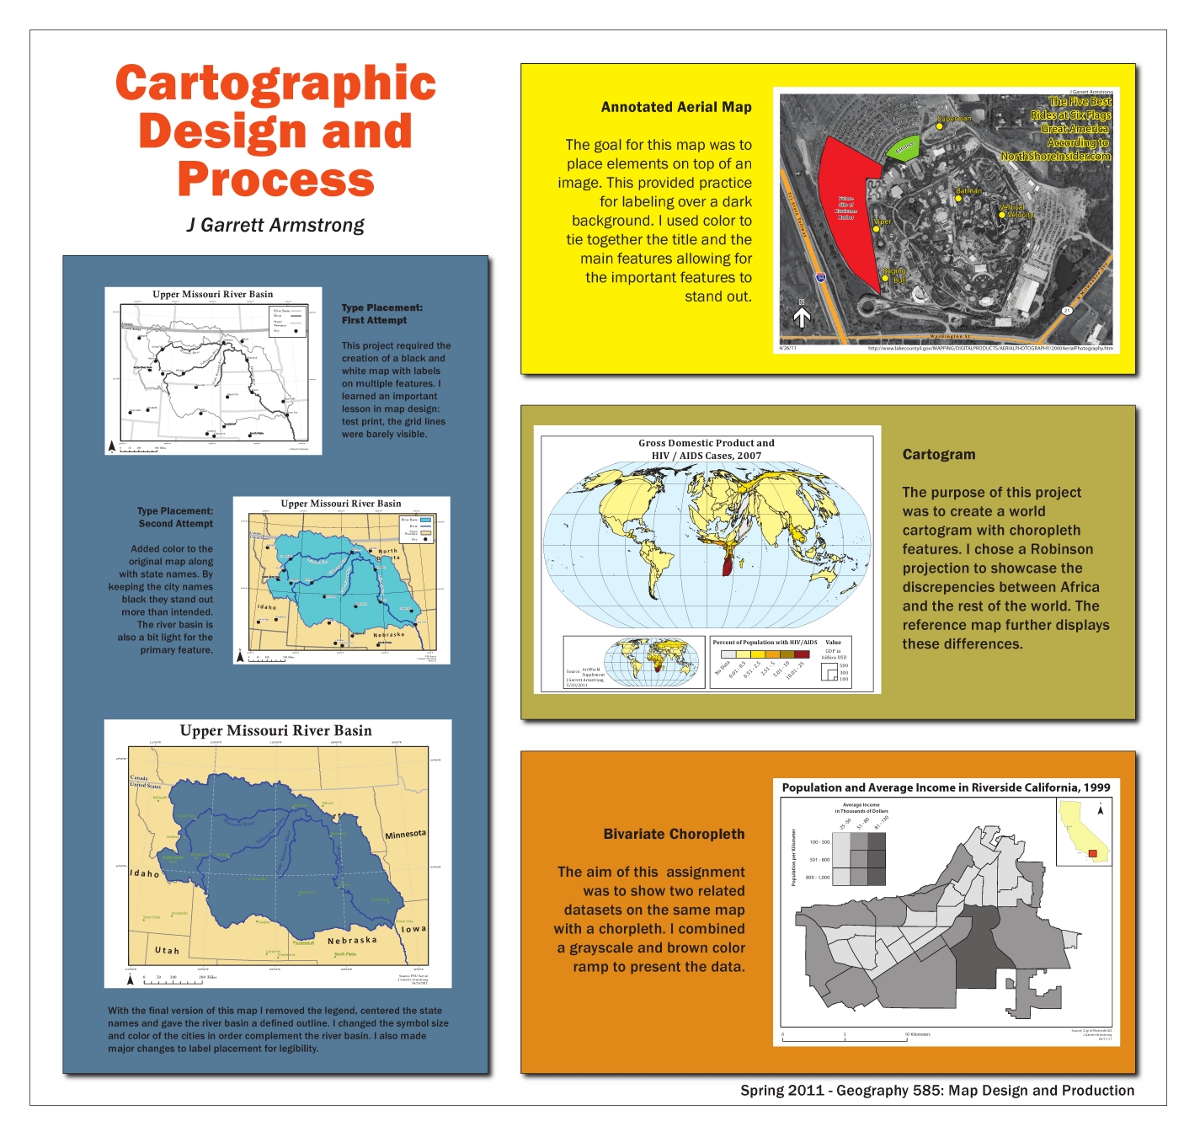
Spring 2011: This was done for a Cartographic Design and Process project that displays the many different projects throughout the whole class.
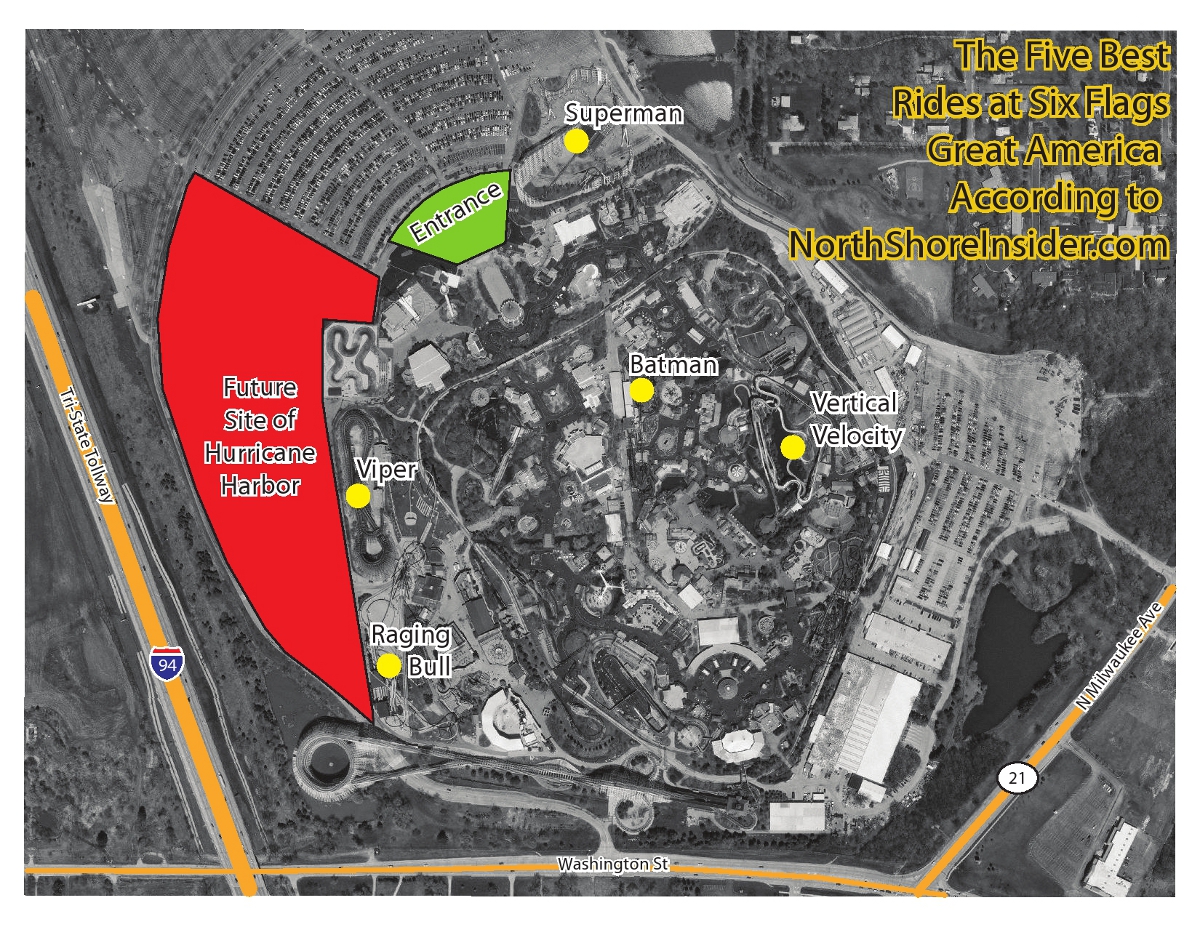
This was an annotated map made from a black and white aerial photo. The goal for this map was to place elements on top of an image. This provided practice for labeling over a dark background. I used color to tie together the title and the main features allowing for the important features to stand out.
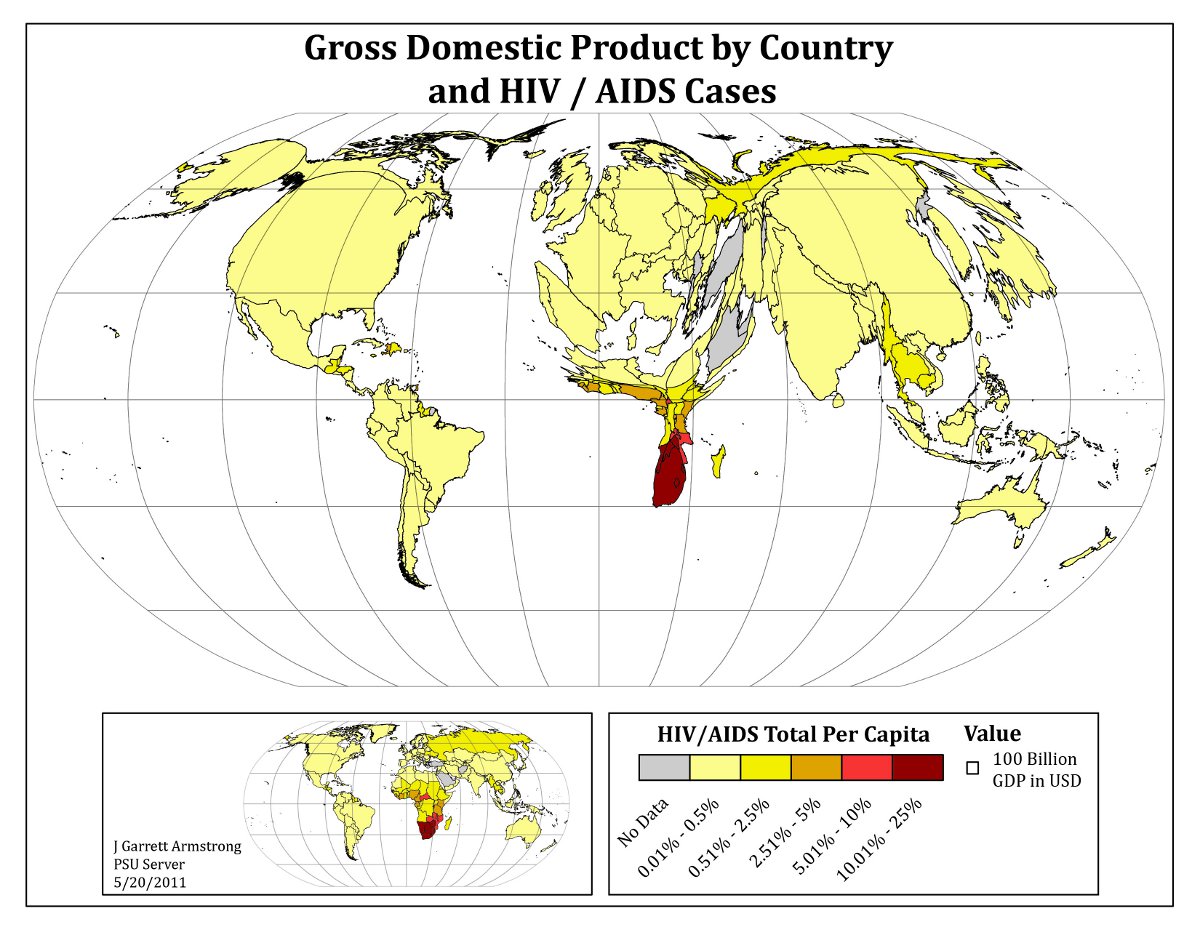
The purpose of this map was to create a world cartogram with choropleth features. I chose a Robinson projection to showcase the discrepencies between Africa and the rest of the world. The reference map further displays these differences.
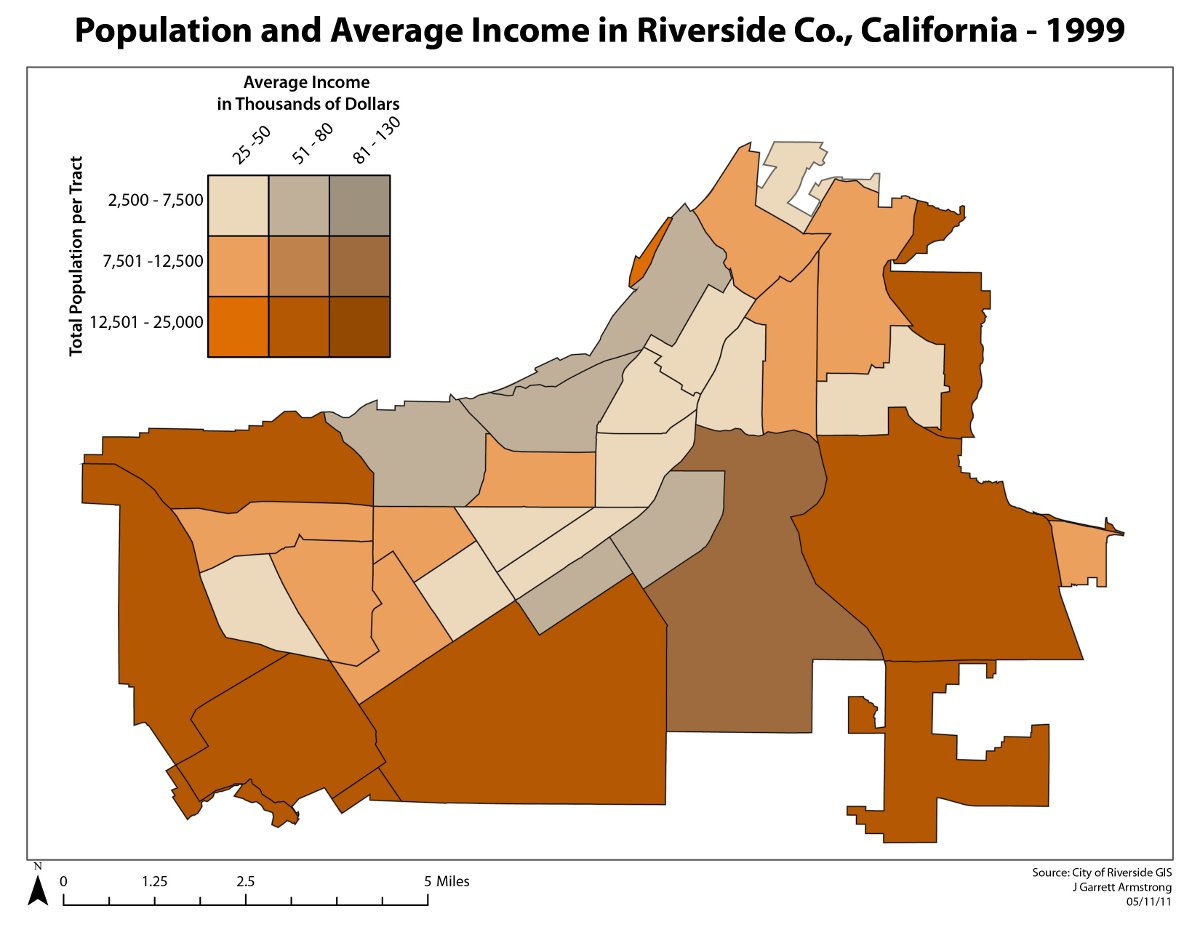
The aim of this assignment was to show two related datasets on the same map with a bivariate choropleth. I combined a grayscale and brown color ramp to present the data.
